Setting Up Homelab With Terraform Ansible Proxmox Grafana Prometheus
The Lenovo ThinkCentre arrived, I couldn’t stop until I had a full observability stack. If you’ve been following along, you know the T2 chip MacBook saga. That chapter is very much closed. I ended up with a brick. The ThinkCentre M80q arrived and I genuinely could not wait to get started. I unboxed it, plugged it in, and did not stop until I had a full observability stack running across two production apps. It was one of those nights.
I had been wanting proper monitoring for Amaro for a while. django-prometheus was already installed, the middleware was in place, the /metrics endpoint was live. But nothing was collecting the data. It was just sitting there producing numbers into the void. I knew I needed a Prometheus server and Grafana, I just didn’t have anywhere to run them. Until now.
What I Built
The goal was to go from zero to a production-grade observability stack, but i did not know i would do it in one sitting haha:
- Proxmox hypervisor on bare metal
- VMs provisioned with Terraform using the
bpg/proxmoxprovider - VMs configured with Ansible playbooks
- Prometheus scraping metrics from two production apps (a Django app and a vanilla PHP app)
- Grafana dashboards showing real production data
- Everything remotely accessible via Tailscale from anywhere
I’m going to be honest, I did not expect to finish all of this in one night. But here we are 😄, automation has really come a long way in computing.
Proxmox First
Flashed the ISO with Balena Etcher, booted from USB, spammed F12 for the boot menu. The installer loaded clean. I did mess up the network config on the first attempt (wrong gateway, wrong IP range) so I reinstalled. Simple fix, a bit annoying.
After the second install I could hit the Proxmox web UI from my laptop. That feeling never gets old honestly.
Tailscale on Proxmox
Straight away I installed Tailscale on the Proxmox host. This means I can SSH into it from anywhere without being on the same network. I wanted everything remotely accessible from the start, not as an afterthought. This decision ended up being critical later when I needed to run Terraform and Ansible from my MacBook while not being on the same local network.
Terraform
I’d been wanting to try Terraform properly for a while and this was the perfect excuse. Instead of clicking around in the Proxmox UI to create VMs, you write HCL code that describes your infrastructure and Terraform talks to the Proxmox API to create it. This means my entire homelab is reproducible from code.
First I created a cloud-init Ubuntu template on Proxmox. This is a base image that Terraform clones when spinning up new VMs. You create it once, then every VM is just a clone with different specs and a static IP injected at boot.
Then I wrote main.tf with two VM resources:
resource "proxmox_virtual_environment_vm" "prometheus" {
  name      = "prometheus"
  node_name = "argsrv"

  clone {
    vm_id = 9000
  }

  cpu {
    cores = 2
  }

  memory {
    dedicated = 2048
  }

  initialization {
    dns {
      servers = ["8.8.8.8"]
    }
    ip_config {
      ipv4 {
        address = "192.168.8.51/24"
        gateway = "192.168.8.1"
      }
    }
    user_account {
      username = "fatima"
      keys     = [var.ssh_public_key]
    }
  }

  network_device {
    bridge = "vmbr0"
  }
}
Ran terraform apply and watched both VMs appear in the Proxmox UI. Genuinely one of the most satisfying things I’ve seen in a while. Two machines, declared in code, provisioned in seconds.
Ansible
Terraform creates the VMs. Ansible configures what’s inside them. I wrote playbooks for Prometheus, Grafana, and Tailscale. The separation of concerns is clean and this is exactly how real infrastructure teams work.
The Tailscale playbook uses a reusable auth key so the VMs join my Tailnet automatically, no manual browser authentication needed:
---
- hosts: all
  become: true
  tasks:
    - name: Download Tailscale install script
      get_url:
        url: https://tailscale.com/install.sh
        dest: /tmp/tailscale-install.sh
        mode: '0755'

    - name: Install Tailscale
      shell: sh /tmp/tailscale-install.sh

    - name: Start Tailscale
      shell: tailscale up --authkey=
Getting Ansible to reach the VMs remotely was the interesting part. Since I’m not always on the same network, I configured Proxmox as a jump host. The inventory.ini uses -J root@proxmox-tailscale-ip so Ansible SSHs into Proxmox first, then hops into each VM. Once Tailscale is installed on the VMs they get their own 100.x.x.x IPs and you reach them directly from anywhere.
Ran ansible all -i inventory.ini -m ping and got two green pongs. Then ran the playbooks. Prometheus up, Grafana up, both in Tailscale. 🎉
Connecting Everything
Prometheus works by scraping a /metrics endpoint on a schedule. So as long as your app exposes that endpoint, Prometheus just needs the URL. No complex networking, no VPN tunnels between servers, just HTTPS.
Amaro (my Django property management app) already had django-prometheus installed with the middleware. I added it as a scrape target:
scrape_configs:
  - job_name: 'amaro'
    static_configs:
      - targets: ['your-django-app.com']
    metrics_path: '/metrics'
    scheme: 'https'
Within a minute it showed as UP. Already collecting real production data.
For the AGILE dashboard (a vanilla PHP app running on a VPS, collecting data for a World Bank-funded education programme across Nigerian states) I used promphp/prometheus_client_php. There was a bit of a saga getting the right library version working with PHP 8.0. Pinned it to 2.6.0 and it worked. Added the metrics counter to header.php which is included on every page, so every single request gets tracked with the page name and HTTP method:
try {
    $registry = new CollectorRegistry(new APC());
    $counter = $registry->getOrRegisterCounter(
        'nigeragile',
        'http_requests_total',
        'Total HTTP requests',
        ['page', 'method']
    );
    $counter->incBy(1, [$_SERVER['REQUEST_URI'], $_SERVER['REQUEST_METHOD']]);
} catch (Exception $e) {
    // fail silently, never break the app
}
The try/catch is important here. Monitoring code should never take down the application it’s monitoring.
Then I opened Grafana, added Prometheus as a data source, and started building dashboards. This part was genuinely exciting because I was looking at real production data for the first time.
What I Can See Now
For Amaro:
- Request rate over time
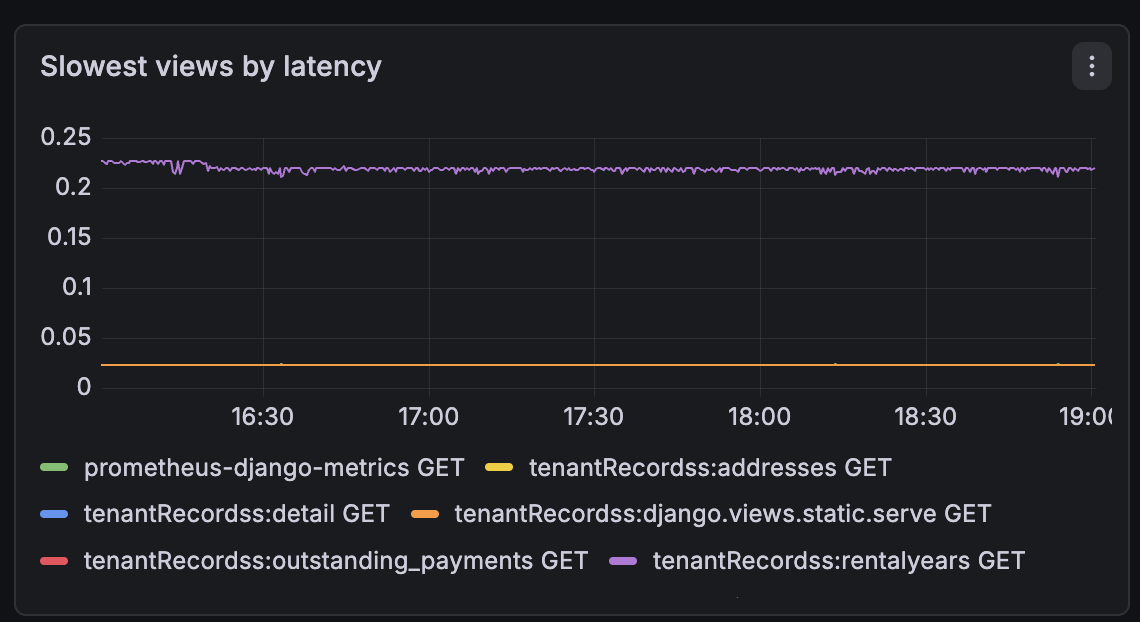
- Slowest views by latency (turns out
outstanding_paymentsis the slowest view, which makes complete sense given the DB queries it runs) - DB query rate
- Response status code distribution
For the AGILE dashboard:
- Which pages are being accessed most (Payments is the most visited, Attendance close behind)
- Request rate over time per page
For the homelab itself, I installed node_exporter on Proxmox and each VM. This gives me system-level metrics across the whole stack:
- RAM usage per machine
- CPU utilisation
- Disk space
- Network I/O
I also set up HTTPS on Grafana using Tailscale’s built-in cert feature. One command generates a real, trusted certificate tied to your Tailnet hostname:
tailscale cert grafana.my-tailnet.ts.net
Point Grafana at the cert files in grafana.ini, restart, done. Clean HTTPS with no self-signed certificate warnings.
What’s Next
The roadmap is getting long. Loki for log aggregation so I can correlate metrics with actual log lines, GlitchTip for error tracking (a self-hosted, lightweight Sentry alternative), and LGA-level tracking on the AGILE dashboard so I can see which of the 22 local government areas are most active on the platform.
The Ansible playbooks also need updating to include node_exporter installation and Tailscale cert generation on every new VM automatically. Infrastructure as code only pays off when the code is complete.
The ThinkCentre is sat on my desk running completely silent. 6GB of RAM in use out of 16GB. Plenty of headroom for what’s coming.
One night. Zero to full observability across two production apps. Worth every minute of lost sleep 😄